
Macros for Fat Loss: A Calculator Workflow With USDA Data
Calculator first workflow using USDA FoodData. Protect protein, log precisely, set macros by the math, and review trends after 2–4 weeks.
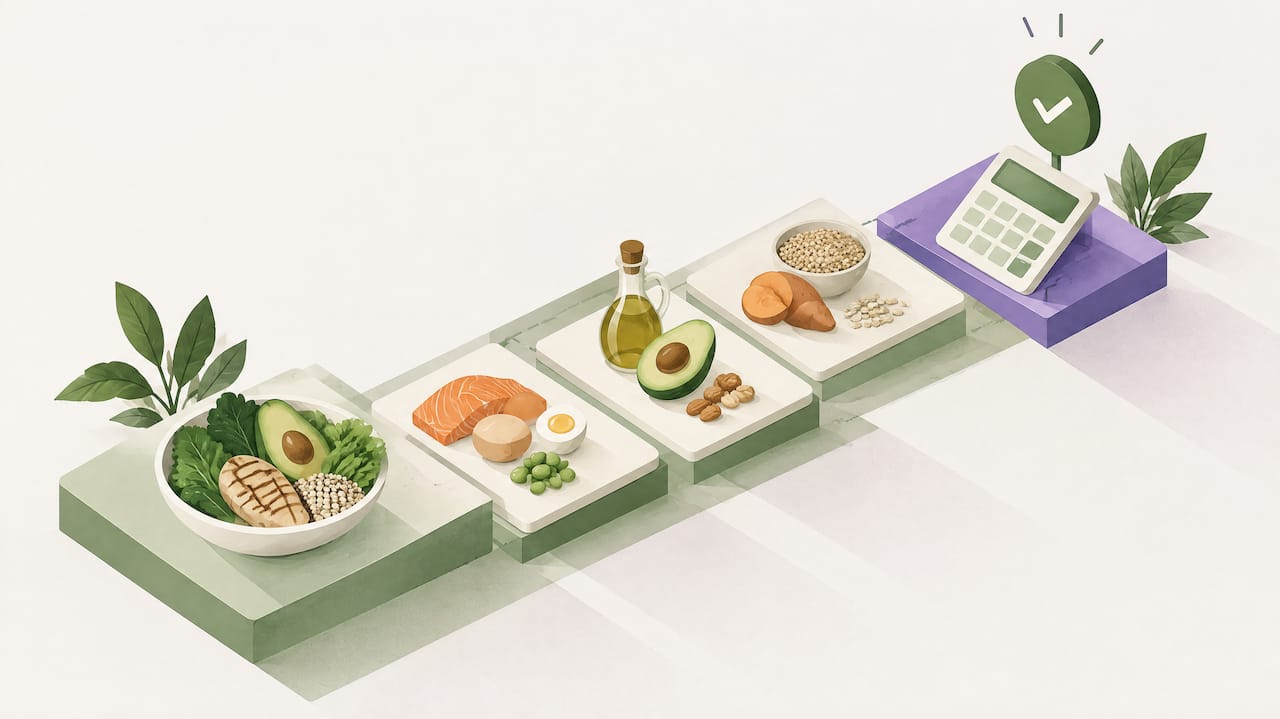
Run a calculator, protect your protein number above all else, and start logging food against USDA FoodData Central values so your numbers hold up in practice, not just on paper.
TL;DR:
- Calculating macros for fat loss requires setting a moderate calorie deficit based on estimated TDEE and fixing protein in grams before adjusting fat and carbs.
- Protein intake should be about 1.6 to 2.2 grams per kilogram of body weight, spread across meals, and timed around training for muscle preservation.
- A commonly effective macro split can range from 30-35% protein, 20-35% fat, and the remaining calories from carbs, with adjustments based on activity level and satiety.
- Logging food accurately, especially calorie-dense ingredients, with a kitchen scale and matching database entries, is crucial to ensure numbers reflect actual intake.
- Long-term fat loss outcomes are similar across macro ratios when total calories and adherence are maintained, so you should choose a split that fits your training and preferences.
Cibo estimates calories, macros, and portions from meal photos, helping you track nutrition without manual weighing or database searches.
Visit CiboHow do you calculate macros for fat loss?
The math behind macros for fat loss is simpler than most people expect once you work through it step by step. You need four numbers in sequence: your maintenance calories, your target calories, your protein grams, and then fat and carbs to fill the rest.
Start with TDEE, your total daily energy expenditure, which estimates how many calories you burn in a day including activity. You can estimate this with an online formula or use the DRI Calculator for Healthcare Professionals from the USDA’s National Agricultural Library, which gives population-based estimated calorie needs as a starting point rather than a fixed prescription. From there, a calorie deficit calculator can translate that TDEE into a daily target.
Once you have TDEE, apply a deficit. Larger deficits can speed up short-term results but tend to hurt training performance and adherence, so most people do better starting moderate and adjusting based on real trend data over several weeks.
Here is the full calculation sequence:
- Estimate TDEE using a calculator or tracked average intake over several weeks of stable weight.
- Subtract 15 to 20% to set your daily calorie target.
- Set protein at 1.6 to 2.2 grams per kilogram of body weight (more on choosing the right end of that range below).
- Multiply protein grams by 4 to get protein calories.
- Choose a fat percentage, generally 20 to 35% of total calories, and divide that calorie amount by 9 to get fat grams.
- Subtract protein and fat calories from your total target. Divide what remains by 4 to get carbohydrate grams.
Pro Tip: Calculate protein and fat first in grams, then let carbohydrate absorb whatever calories are left. This keeps your two most consequential variables, protein for muscle retention and fat for hormone function, fixed while carbs flex with training demand.
The conversion factors themselves come from standard nutrition science: protein and carbohydrate both provide 4 calories per gram, while fat provides 9 calories per gram, according to USDA food and nutrition guidance. These factors never change regardless of diet style, which is why they anchor every macro calculation.
A worked example: say someone has a TDEE of 2,400 calories and weighs 80 kg. A 20% deficit sets the daily target at 1,920 calories. Protein at 2.0 g/kg is 160 g, or 640 calories. Fat at 30% of the target is 576 calories, or 64 g. That leaves 704 calories for carbohydrate, or 176 g.
Once you have these three numbers, the final step is verification. Log a few days of typical meals and compare what you’re eating against USDA FoodData Central entries for the same foods. Packaged foods, restaurant meals, and home-cooked dishes all carry different margins of error, and catching a mismatch early saves weeks of chasing a target that was never accurate to begin with. The macro calculator can do this arithmetic for you once you’ve settled on your inputs, which is useful for double-checking math by hand.
Which macro split actually fits your training and your life?
There is no single best ratio for fat loss. The Acceptable Macronutrient Distribution Ranges set by the NIH Office of Dietary Supplements put carbohydrate at 45 to 65% of calories, fat at 20 to 35%, and protein at 10 to 35% for the general population. These are adequacy ranges meant to prevent deficiency and support health, not a formula tuned specifically for losing fat, so think of them as guardrails rather than a target to hit precisely.
For people training regularly, the 2018 Sports Health review “Fueling for Performance” cites roughly 1.2 to 2.0 g/kg/day of protein and 3 to 10 g/kg/day of carbohydrate for athletic contexts, with fat again commonly recommended at 20 to 35% of calories. These ranges assume a performance context and may need adjusting downward on carbohydrate during a cut, since calorie availability shrinks even as training continues.
A few practical starting splits work well for most people cutting calories:
- Balanced: roughly 35% protein, 30% fat, 35% carbohydrate, good for general fat loss with moderate training.
- Higher carb: roughly 30% protein, 25% fat, 45% carbohydrate, suited to higher training volume or endurance work.
- Lower carb: roughly 35% protein, 35% fat, 30% carbohydrate, useful for people who feel more satiated with less carbohydrate or who train less frequently.
Matching carbohydrate to training matters more than most ratio debates. Someone lifting four times a week or running several times a week benefits from carbohydrate clustered around those sessions, since it supports output and recovery. Someone with a mostly sedentary routine can run comfortably at the lower end of the carbohydrate range without losing much in performance.
Satiety, food preferences, and any medical considerations should weigh heavily in your choice. A split you can’t stick to for more than two weeks isn’t a better split, it’s a worse one. Stricter low-carb approaches can suit people with insulin resistance or certain medical guidance, but that decision belongs with a doctor or dietitian, not a default recommendation.
How do you log food accurately enough for the numbers to mean anything?
Macro math only works if the numbers you log reflect what you actually eat. Calorie-dense foods carry the highest risk of error: a tablespoon of olive oil or dressing can run 100 to 120 calories, and eyeballing it instead of weighing it is one of the most common ways people stall progress without understanding why.
A kitchen scale solves most of this. Weigh oils, nut butters, cheese, and nuts whenever possible, since small volume differences translate into real calorie swings for these foods. Lower-density foods like vegetables and most fruits carry more forgiving margins and can usually be estimated with less precision.
Choosing the right database record also matters. USDA FoodData Central organizes entries into Foundation Foods, Branded Foods, FNDDS, and SR Legacy datasets, each updated on its own schedule. Branded Foods entries are best for packaged products with a label match, while Foundation Foods suit raw or minimally processed items like a cod fillet or a cut of produce. Picking the closest match and noting your choice when auditing logs keeps your numbers consistent over time.
A few habits reduce logging drift:
- Weigh calorie-dense ingredients like oils, dressings, nuts, and cheese rather than estimating by eye.
- Match the preparation method in the database entry to how you actually cooked the food, since raw and cooked weights differ substantially.
- Choose Branded Foods for packaged items and Foundation Foods for raw ingredients to reduce mismatch error.
- Review your weekly log for repeated entries that look suspicious and correct the underlying habit, not just the one entry.
Food composition data varies by brand and preparation method, which means two products with the same name can carry different calorie counts. Precision improves when you match the exact product and portion rather than grabbing the first similar-sounding entry in a database.
Set aside time weekly to audit your logs rather than reacting to daily fluctuations. Look for a pattern: if you’re consistently guessing restaurant meals or skipping oil measurements, that’s where to tighten up first.
Why protein comes first, and how to time it around training
Protein gets fixed before anything else in a fat-loss plan because it protects lean tissue while calories are restricted, which matters more during a deficit than at maintenance. The same Sports Health review places athletes in the 1.2 to 2.0 g/kg/day range, and people cutting calories generally do better toward the upper half of that range since protein needs rise relative to overall intake when total calories drop.
When calculating protein for someone with a higher body fat percentage, basing the number on total body weight can overshoot. A review on protein requirements during weight loss recommends using reference or adjusted body weight instead, since protein needs track lean tissue rather than fat mass. A protein calculator can help apply this adjustment without manual guesswork.
Distribution across the day matters almost as much as the daily total:
- Spread protein across 3 to 4 meals rather than loading it into one or two, since this supports more consistent muscle protein synthesis throughout the day.
- Aim for roughly 25 to 40 g of protein per meal, enough to provide a meaningful anabolic stimulus without needing to hit an exact number.
- Place a protein-containing meal within a few hours of resistance training sessions, since this is when the body is most responsive to amino acid availability.
People who are pregnant, breastfeeding, managing a medical condition, taking medications affected by diet, or recovering from disordered eating should work with a clinician or registered dietitian rather than applying generic protein targets, since individual needs can vary substantially from population averages.
What does the research actually say about macro splits for weight loss?
Large randomized trials comparing different macronutrient compositions, including low-fat versus low-carb approaches and varying protein levels, have generally found similar long-term weight loss outcomes when calorie deficit and adherence were comparable across groups. This is one of the more consistent findings in weight-loss research, and it reshapes how to think about the ratio debate entirely.
The practical takeaway: adherence and total calories matter more than hitting one specific “ideal” ratio. A split that fits your schedule, appetite, and training is more likely to produce results over months than a theoretically optimal split you abandon after two weeks.
That doesn’t mean ratios are irrelevant, just that they operate within boundaries rather than requiring precision. The AMDR ranges from the NIH Office of Dietary Supplements, carbohydrate at 45 to 65%, fat at 20 to 35%, and protein at 10 to 35% of calories, define a safe zone for the general population. Athletes and highly active people can reasonably push protein and carbohydrate toward the upper end of athletic guidance ranges without leaving established safety bounds.
A few points worth internalizing from this body of evidence:
- Different macro compositions can produce comparable fat loss when calories and adherence are held constant.
- Chasing a precise ratio matters less than maintaining a deficit you can sustain for months.
- Population ranges like the AMDR exist to prevent deficiency, not to prescribe an optimal fat-loss formula.
This evidence doesn’t mean macros don’t matter. It means the split should serve your adherence and training, not the other way around.
Two worked examples you can copy
Seeing full arithmetic end to end makes the workflow concrete. Here are two scenarios using different starting points.
Example A: a 75 kg adult with a 2,200-calorie TDEE and light training.
- Apply a 15% deficit: 2,200 x 0.85 = 1,870 calories.
- Set protein at 1.6 g/kg for light training: 75 x 1.6 = 120 g, or 480 calories.
- Set fat at 30% of total calories: 1,870 x 0.30 = 561 calories, divided by 9 = 62 g fat.
- Give carbohydrate the rest: 1,870 − 480 − 561 = 829 calories, divided by 4 = 207 g.
Example B: a 68 kg athlete with a 2,600-calorie TDEE and five weekly training sessions.
- Apply a 15% deficit: 2,600 x 0.85 = 2,210 calories.
- Set protein at 2.0 g/kg for five weekly sessions: 68 x 2.0 = 136 g, or 544 calories.
- Set fat at 25% of total calories: 2,210 x 0.25 = 553 calories, divided by 9 = 61 g fat.
- Give carbohydrate the rest: 2,210 − 544 − 553 = 1,113 calories, divided by 4 = 278 g, about 4.1 g/kg.
Enter these numbers into a macro calculator or a spreadsheet to double-check the arithmetic, then hold steady for 2 to 4 weeks. Review your weight trend and energy levels before making any changes, and adjust calories before touching protein, since protein is the variable doing the most work to protect lean tissue during the deficit.
How Cibo’s tools support this workflow
Running this math by hand works, but it’s easy to make small errors or lose track of inputs over time. The Cibo tools page hosts a macro calculator and a calorie deficit calculator built around the same sequence described above: TDEE first, then a conservative deficit, then protein, fat, and carbs in grams.
Once targets are set, logging accuracy is what determines whether they mean anything day to day. AI photo logging estimates calories, macros, and portions from a picture of a meal, which speeds up the weighing and database-matching steps covered earlier. Entry by voice, text, barcode, or manual input covers the cases where a photo isn’t practical, like a packaged product with a barcode or a dish eaten away from home.
None of this replaces professional guidance. Macro targets generated by any calculator are a starting estimate, not a medical recommendation, and anyone managing a health condition should check with a doctor or registered dietitian before making significant dietary changes. The values Cibo uses for whole foods come from USDA FoodData Central; packaged foods come from Open Food Facts.
Adjusting macros for vegetarian, vegan, and keto approaches
The calculation workflow stays the same across dietary patterns. Only the food choices that fill each macro category change.
For vegetarian or vegan patterns, protein becomes the variable to watch most closely, since plant protein sources often require larger portions to hit the same gram target as animal protein. Combining legumes, tofu, tempeh, seitan, and soy products across meals, rather than relying on a single source, makes it easier to reach protein goals without excessive volume. Fat and carbohydrate targets calculate identically, just sourced from plant oils, nuts, seeds, grains, and legumes instead.
Keto approaches push fat toward the top of the 20 to 35% AMDR range and beyond, with carbohydrate cut sharply, often below 50 g per day, which falls well outside the standard 45 to 65% carbohydrate range set by the NIH Office of Dietary Supplements. Protein still calculates using the same g/kg method described earlier. Because this approach sits at the edge of established nutrient ranges, it’s worth discussing with a doctor or dietitian before adopting it long term, particularly for anyone with existing metabolic or kidney conditions.
Whatever the pattern, the core sequence never changes: calories first, protein next, fat as a percentage, carbs as the remainder.
Macros are a hypothesis, not a verdict
Every macro plan is a guess worth testing, not a rule to obey blindly. The same math can produce different results for different people, which says less about the arithmetic being wrong and more about bodies responding to deficits, training, and stress in their own ways. The plan you calculate this week is a starting point, not a verdict on what will work for the next three months.
What matters more than the ratio is whether you can follow it consistently enough to gather real data. Two weeks of inconsistent logging tells you nothing. Three to four weeks of honest tracking, even with an imperfect split, gives you a trend line worth acting on.
Pick the version of this plan you can actually stick to, not the one that looks most optimized on paper. Adjust calories before protein, and give changes time to show up in the data before second-guessing the math.
Making the daily math easier
Calculating macros by hand works, and the steps above will get you there. Where we can help is in cutting the time it takes to apply that math meal after meal. Cibo uses AI photo logging to estimate calories, macros, and portions from a picture, which removes most of the manual database searching described earlier in this guide.
Two features map directly onto the workflow here:
- AI photo, voice, text, barcode, and manual logging to capture meals quickly and match them against food composition data.
- Macro and TDEE calculators to set your targets using the same sequence this guide walks through.
Cibo offers a 7-day trial followed by a subscription to unlock ongoing tracking if the basic tier’s logging limit is insufficient. Check Cibo’s tools to apply your numbers today.
This article is general information, not a substitute for advice from a qualified doctor. Consult a qualified healthcare professional about your own circumstances before acting on anything here.
FAQ
What macro ratio is best for fat loss?
There is no single best ratio. Research comparing different macro splits shows similar long-term weight loss when calorie deficit and adherence are comparable, so the split that fits your training and appetite tends to outperform a theoretically ideal one you can’t sustain.
Is 40/30/30 good for fat loss?
A 40% carbohydrate, 30% protein, 30% fat split keeps protein and fat inside the NIH’s Acceptable Macronutrient Distribution Ranges, while carbohydrate sits a little below the 45 to 65% range set for the general population. That trade is common in a higher-protein fat-loss phase and makes it a reasonable starting point for many people. Whether it works well for you depends more on whether you can sustain the calorie deficit it’s built on than on the ratio itself.
How do I figure out my macros for fat loss?
Estimate your maintenance calories (TDEE), subtract 15 to 20% for a moderate deficit, and set protein at 1.6 to 2.2 g per kg of body weight. From there, choose a fat percentage between 20 and 35% of calories, convert to grams, and let carbohydrate fill whatever calories remain using the standard conversion factors from USDA guidance.
Is a 50/30/20 macro split good?
A 50/30/20 split (50% carbohydrate, 30% protein, 20% fat) sits inside the AMDR, with fat at the low end of the 20 to 35% range, so it’s worth monitoring energy levels and satiety to confirm it still feels sustainable over several weeks.
Sources
- Dietary Reference Intakes and nutrient recommendations — NIH / ODS
- Fueling for Performance — Bytomski, Sports Health, 2018 (PMC)
- USDA FoodData Central
Recommended
Not medical advice. Cibo is a nutrition-awareness tool, not a medical device. Read the full disclaimer.
Build healthier habits with Cibo
Nutrition made simpler for everyday life.


